
 Medialab-Matadero Madrid
Visualizar'07: Advanced Project Production Workshop Showcase
Desde 04/12/2007 12:12 hasta 24/02/2008 12:02
Visitors will have the chance to explore the transformation process and the current status of each and every project in an interactive and dynamic way, using computers that will be available at the exhibit.
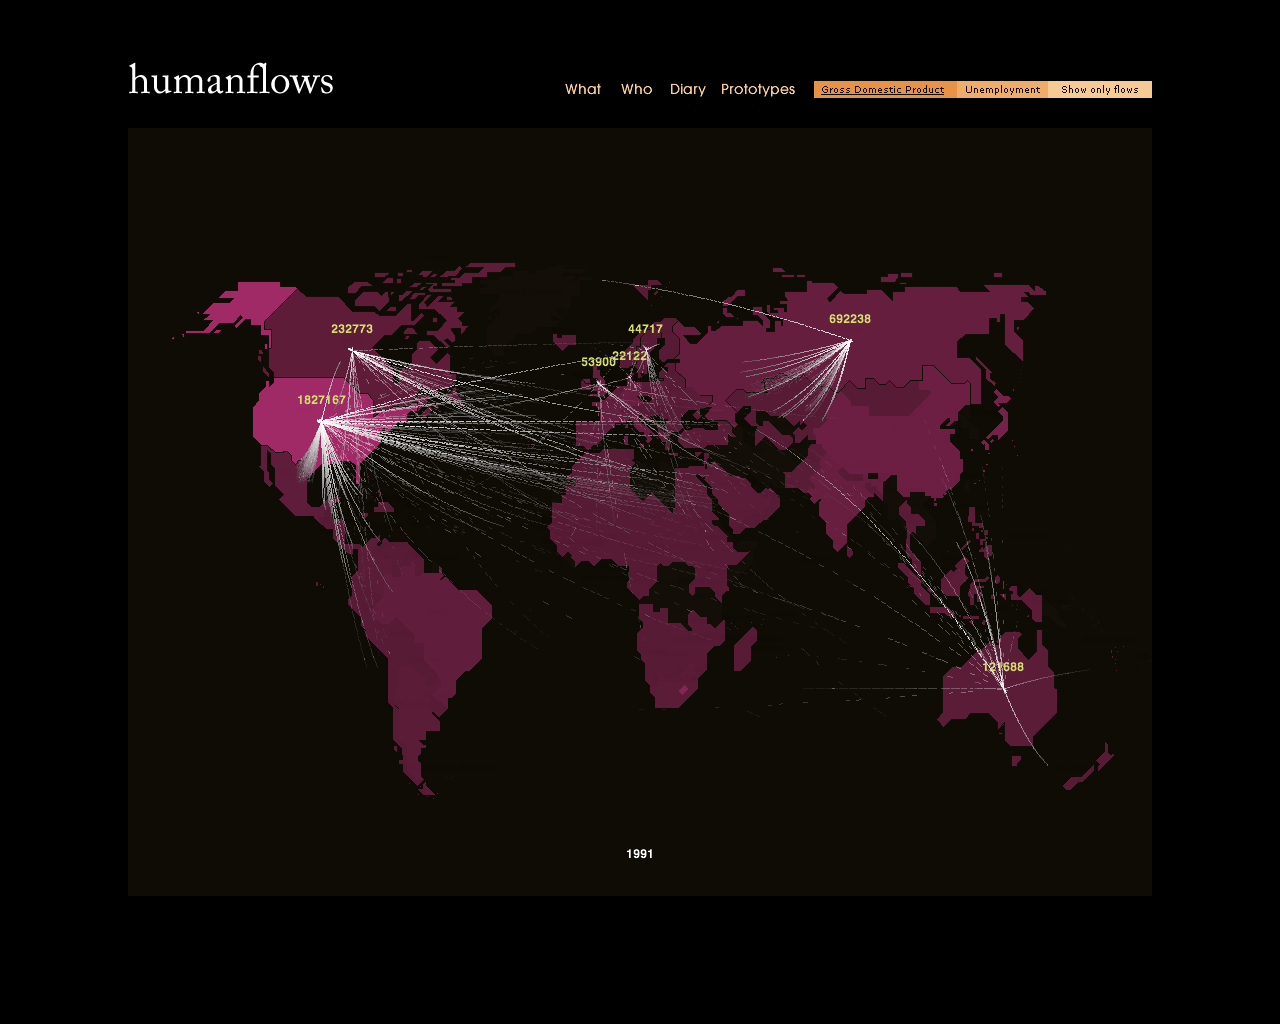
Human Flows
By Miguel Cabanzo (Italy)
With Nathan Yau, Mónica Sánchez and Iman Moradi.
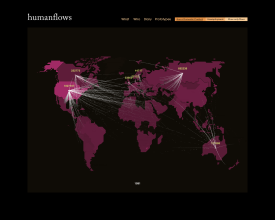
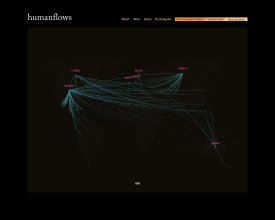
A project to visually and interactively mapping global migrations in a bid to understand its causes. In its current state, it is a framework with which to develop further visualisations.
www.2ngry.com/humanflows Mail Garden: Human Centered Data ViewBy Wilkens Kjen (Germany)
With Damian Stewart, Jenny Cahier, Marcela Machuca
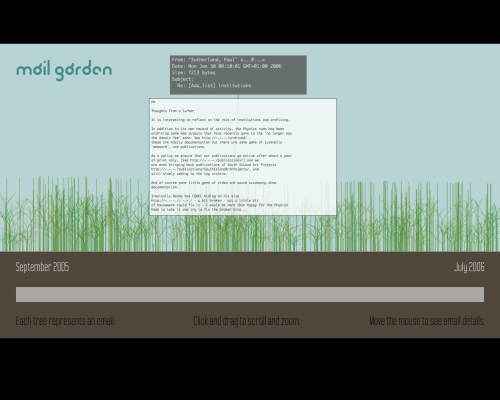
Human Centered Data View is about creating spaces for personal reflection on digital communication. The first phase of this project, Mail Garden, visualises the contents of one mailbox on your computer as a forest of trees. Each tree in this forest represents an email, with the height of the trees reflecting the length of the mail. Moving your mouse over a tree shows some details about the email. The overall aim is to create a view of your mailbox that encourages a more reflective kind of conciousness.
In the future versions we envisage more options for the data used to generate the trees to represent individual people (one tree per person, with each brach representing a single email sent by this person), email threads (one tree per thread, with each brach representing an email in the thread).
Looking further into the future, we envisage the ability to visualize other kinds of communication-related data, including instant messaging history and calendar data, and to do all of this with an open architecture that allows anyone to create a plugin to import and visualize their own kind of data.
http://human-centered-visualizations.com/
Metabolic Visualizer
By Ricardo Carvalho, Hernani Dias, Miguel Cardoso (Portugal)
With Belén Illana, May Olmo Caballero, Rodrigo Santamaría, Roberto Therón
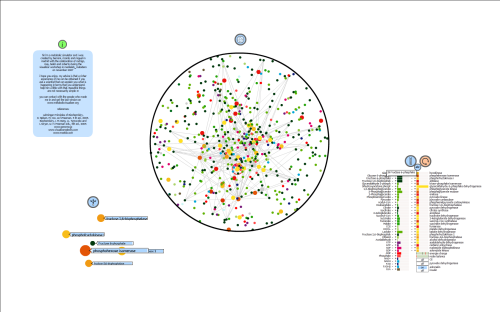
A metabolic simulator which allows users to visualise reactions between compounds and enzymes, and the changing relations on the evolution of the compounds and enzymes types throughout the simulation.
www.metabolicvisualizer.org
www.genome.jp/kegg/pathway.html
tweetPad
By Elie Zananiri (Canada)
With Eric Gullberg, Lysanne Bellemare
tweetPad is software used to visualize Twitter feed in a new, dynamic fashion. The idea is not to only be on the receiving end of these feeds but also to be able to manipulate them; to react to and interact with what we are reading. This is done by deconstructing the text; scrambiling the letters or words, breaking sentences apart, replacing words, combining multiple entries into one, etc.
tweetPad also visualizes statistics on the source of the incoming messages (web, sms, instant messages, or 3rd party software) and the number of characters per message.
tweetPad's interaction is playful and intuitive, using simple mouse gestures to perform all actions.
http://silentlycrashing.net/tweetpad/
Cascade on Wheels
By Steph Thirion (Spain)
With Cristóbal Castilla, José Hernández, Ricard Marxer, Julian Oliver, Nicolas Tremeaud
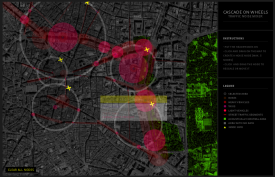
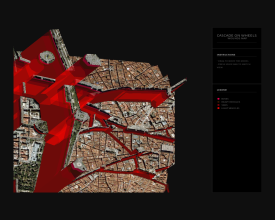
Cascade on Wheels intends to express the quantity of cars we live with in big cities nowadays. We choose to visualize a data set of daily car count averages per street (and segments of streets) in the Madrid city center in 2006. By narrowing the data by individual streets, it becomes much easier to understand and relate to it, since it talks about specific places we know as inhabitants of the city.
The enormity of car traffic is harmful in many ways to the city and its people. We choose not just to visualize the data in an informative way, but also to express its meaning.
We made two visualizations of the same dataset. One is a 3-dimensional representation, where holes are used as a metaphor of the volume of cars, in a map where the streets look like open wounds. The second is a sound toy, where noise is the metaphor, and the user has to explore the data by drawing its own visualizations.
Barriblog
By Mari Luz Congosto (Madrid, Spain)
With Tíscar Lara, Jesús Sánchez, Pilar Gonzalo
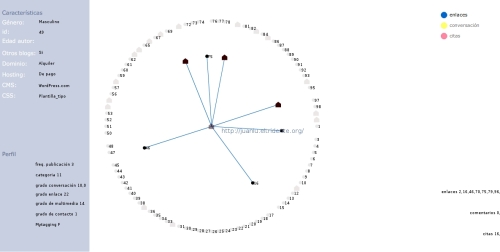
Barriblog is a project that aims to explore the contents of blogs to determine the keys to their identity: their social side, the types of contents, and how close they are to other blogs, in order to study the kinds of networks they form and how they can be visualized.
http://www.barriblog.com
Casastristes.org
By Mar Canet, Gerald Kogler, Jordi Puig (Barcelona, Spain/Reino Unido)
With Marcel F, Coco Moya, Carla Capeto, Hilario Álvarez, Yolanda Spínola, Fran Castillo, Jesús Rodríguez, Abraham Manzanares
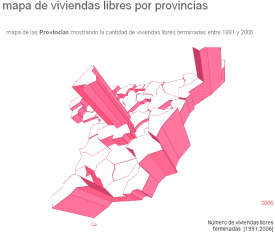
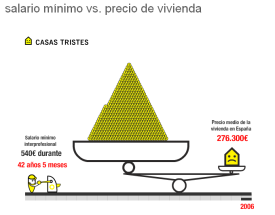
Casastristes.org aims to provide a broad overview of housing problems in Spain, examining both causes and consequences. Its objective is to serve as an information and resources exchange platform in line with the Web 2.0 philosophy, through the creation of a reliable public database of empty houses in Spain.
By providing data visualization and publications on the blog, it also aims to offer resources of use in clarifying ambiguous concepts and strengthening the network of citizens, associations, collectives, etc. who are concerned about housing and need a way to communicate with each other, become visible, and make proposals.
Casastristes.org is a continuously growing collective search for a broad perspective on one of the difficult problems we face as residents, as citizens. It questions concepts such as "the advantages of buying a home instead of renting", and highlights the abundance of empty houses in contrast to the generally accepted theory of "a lack of buildable land". Our purpose is to look for solutions given the extremely high percentage of empty homes in Spain, evaluate the reasons so many people do not leave their parents' home until age 35, and propose alternative housing policies.
Memory Islands
By Miguel Albadán (Colombia)
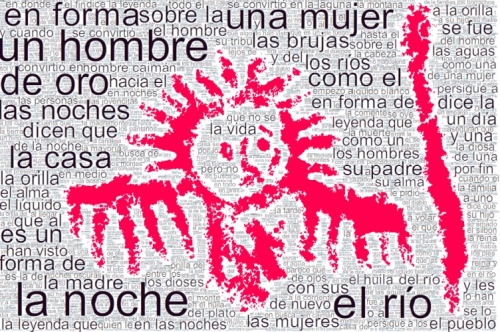
Cave images remain virgin territory within our unconscious and our rational being attempts to converse with them. For thousands of years, humans have used words to construct the identity of different peoples. These images have remained as enigmatic islands sunk in the complex ocean of human language, where each word navigates through history competing for its place. This is a first attempt at visualizing our memory.
MemoryIslands redraws the map of each of these islands, through a combined process of collecting texts manually (legends, myths, stories) in a single file for each area (country), filtering the files in Phyton which generates a new text file with a statistical list of the most recurrent phrases and words (thanks Adrian and Ricard), and finally, interpreting them and assigning them a place on the empty areas in the image (cave art in the area) through Action Script (thank you Santiago, Ricard, Cristobal and José Luis).
http://memoryislands.wordpress.com
FoodCultura
By Natalia Muñoz (Colombia)
With Antonio Miralda, Alicia Ríos, Miguel Albadán
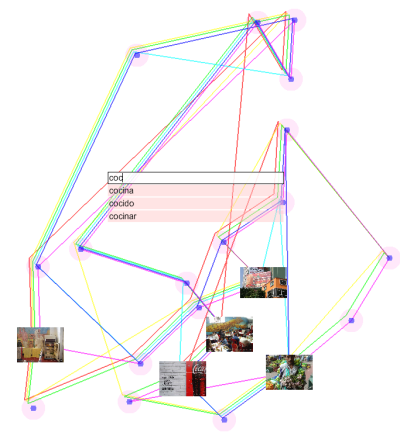
It is a graphic structure that uses colour as an additional channel of information and provides public access through the Internet to the large artistic archives of Antoni Miralda, a collection of photographs, objects, videos, installations, and songs related to food culture.
The project is structured through free software, Flickr, Dailymotion and WorldPress, and through key words linked to CMYK values that will unify the different types of documents comprising those archives.
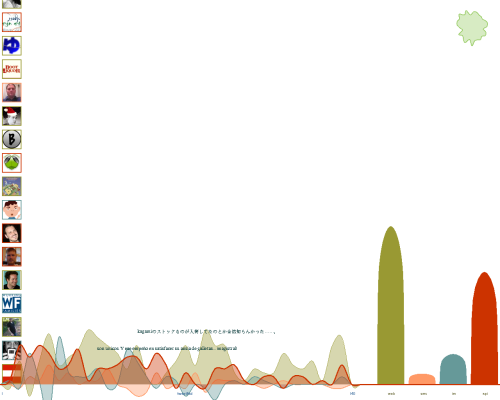
Spamology
By Irad Lee (Holland)
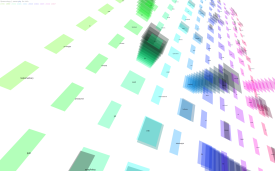
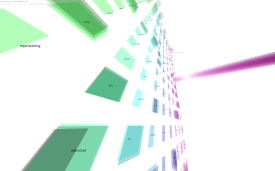
Spamology is an interactive audiovisual representation of popular words in Spam E-mail messages. The visualization is based on analysis of a private archive of Spam messages which were collected during 10 years (1998-2007), containing up to 2,000,000 Spam E-mail messages originated from various parts of the world.
In Spamology, spam data is audiovisualized in a 3D environment, where popular words from the spam archive are represented as rectangular structures of various heights, illustrating the occurrence rate of each word in the archive. next to the visual representation, each word generates an audio signal with an audio frequency related to the number of times it occurred during a certain year. Words of various frequencies flow through the 3D landscape simultaneously, forming a constantly-changing sonic texture.
Sessions of the activity
The activity is over