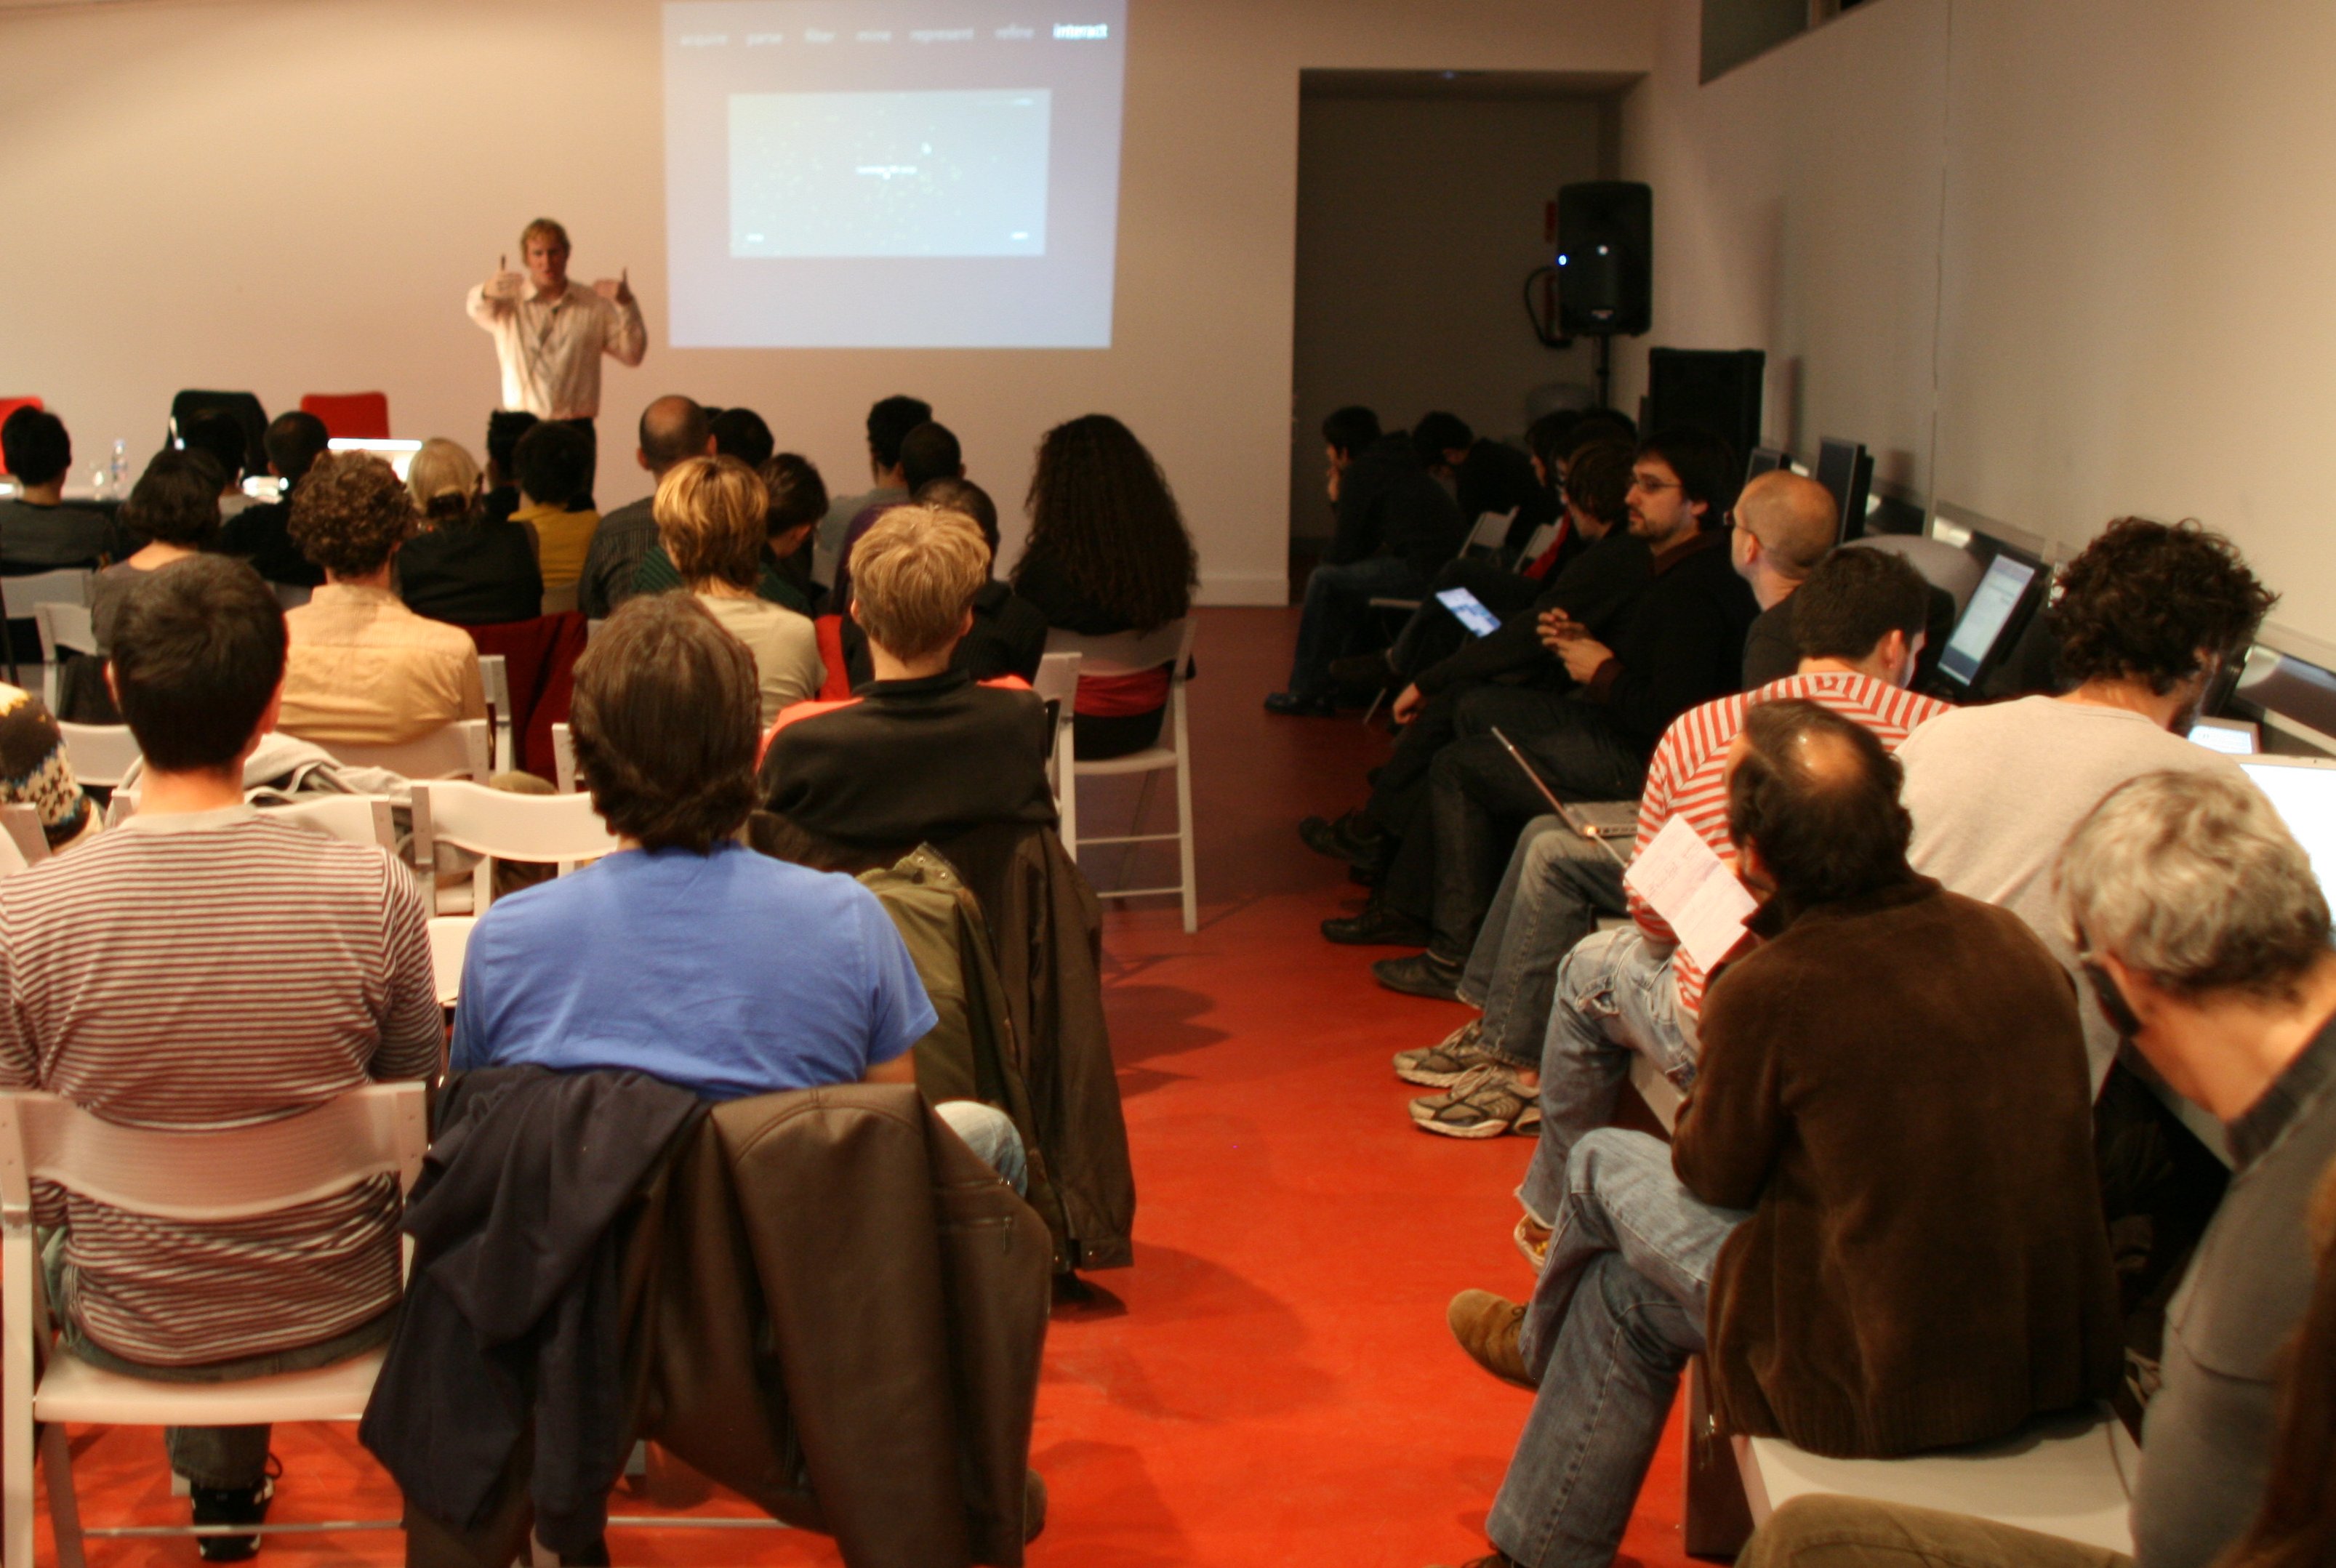
Visualizar Symposium

At the start of the 21st century, the generation of endless masses of data has become one of the primary scientific, economic, and social activities. Those masses of data are such vast, complex structures that perhaps the best way to make everyone understand the relations and see the meaningful patterns hidden among them is not to use words. Maps, signage, and statistical graphs have been traditional ways of showing the relationship among specific items visually. However, now that we generate and gather much more data practically in real time, we need systems that represent them dynamically and the answers they hide. Thus, the art and science of data visualization was born.
Data visualization is a cross-discipline which uses the vast communicative power of images to offer a comprehensible explanation of the relationship among meaning, cause, and dependence that can be found among large abstract masses of information generated by scientific and social processes. Arising from the field of science two decades ago, InfoVis and DataVis combined strategies and techniques from statistics, graphic design and interaction and computer analysis to create a new communication model more suitable for clarification in the emerging Age of Complexity. José Luis de Vicente
Papers
- Sheila Pontis - The History of Schematics in Data Visualization [+info]
- Manuel Sánchez-Gestido - Information Visualization and Structured Knowledge[+info]
- Daniel Rojas - On Network Topology Visualization[+info]
- Paloma López - Research on Experimental Interactive Visualization of Etymological Knowledge [+info]
- Domenico di Siena - Imaginario[+info]
- Marcela Alejandra González - Information tools for Ethical Consumers [+info]
- Mariluz Congosto - Barriblog [+info]
Lectures
- José Luis de Vicente: VISUALIZAR presentation [+info]
- Ben Fry: Computational Information Design [+info]
- Santiago Ortiz y Andrés Ortiz (Bestiario): Presentation of Bestiario projects [+info]
- Ramon Guardans: From the Nippur School to EMEP: 4.000 years of data representation [+info]
- Mark Hansen: Art and Stadistics [+info]
- Fernanda Viégas: Many Eyes: Democratizing Visualization [+info]
- Alberto Cairo: Visualization on Information in the Press [+info]
- Adrian Holovaty: Journalism Via Computer Programming [+info]
- Staffan Landin (Gapminder Foundation): ¿Is the World Improving? ¿Y por qué no nos damos cuenta? [+info]


 Medialab-Matadero Madrid